Business analysis
Clarify stakeholder needs, define reporting rules, and connect requirements to acceptance criteria.
Review delivery ownershipSenior Business Analyst · Business Intelligence & Financial Analytics
I’m Matthias Mbarga, MBA. I help teams define reporting requirements, align financial KPIs, and connect source data to decision-ready dashboards. My background spans business analysis, enterprise systems, and financial analytics.
Selected work · Financial intelligence
Independent analysis · Pfizer FY2025 public filing
Clarify stakeholder needs, define reporting rules, and connect requirements to acceptance criteria.
Review delivery ownershipTrace metrics to their sources, reconcile calculations, and explain what a dashboard means for a decision.
Inspect analytical evidenceMap source fields, define data rules, and coordinate business and technical contributors through validation.
Review mapping and controlsSanitized employer case · Dominion Systems Inc.
Fragmented financial and operational inputs required repeated manual reconciliation across contract reporting work.
Consolidate reporting into Power BI and Tableau workflows with agreed KPI definitions and source-to-report rules.
Led requirements discovery with finance, data, and engineering stakeholders; defined KPI logic, source-data needs, reporting rules, and acceptance criteria. Traced source fields to reporting outputs and coordinated validation and UAT using Jira and Confluence.
The Program Manager approved the approach after reviewing the results. Stakeholders reviewed completed work and used the resulting workflow within the engagement scope; client approval remained with authorized stakeholders.
Reported outcome: Dominion Systems Inc. internal program reporting indicated approximately 30% fewer manual reporting cycles following reporting consolidation.
This is an internally reported program-level result, not an engagement-specific independently audited measure. The exact counted unit, baseline and post-change counts, comparison dates, and measurement owner are not documented in the public brief. January 2022–present identifies the role period. Client-specific records remain confidential.
I owned the analysis and coordination described above. The Program Manager reviewed and approved the approach; authorized stakeholders retained client approval. Stakeholder use is reported within the engagement scope. Deployment dates, production user counts, infrastructure ownership, and team size are not specified in the public account.
Representative example of my Dominion Systems Inc. reporting work
Developed using public Pfizer financial data, this example reflects the requirements, source mapping, validation, and dashboard methods I applied in Dominion Systems Inc. client engagements. Client information is excluded.
Does free cash flow cover cash dividends?
Define fiscal year, USD millions, metric rules, and acceptance checks.
Map the prepared public-data CSV to metric-year records in SQLite.
Check unique keys, source basis, NULL values, and the cash reconciliation.
Present cash-flow coverage and the gap with traceable calculations.
The diagram summarizes the portfolio workflow. The local SQL model and dashboard are inspectable artifacts; an automated production connection is not claimed.
Does annual free cash flow cover cash dividends, and can the calculation be traced to its inputs?
Defined metric rules, documented source-to-target mapping, built the local SQL model, and recorded technical acceptance checks.
Preserved missing values as NULL rather than zero and separated cash-flow coverage measures to avoid misleading interpretation.
The selected FY2025 figures show free cash flow below cash dividends. Local checks passed for record uniqueness, source basis, missing values, reconciliation, and decision measures.
One named metric per fiscal year, with amounts expressed in USD millions. A composite key prevents duplicate metric-year records. This compact model does not demonstrate a multi-system production join pipeline.
Missing source values remain NULL. Checks reconcile operating cash flow less capital expenditure to free cash flow; NULLIF protects division by zero.
Separate operating cash flow and free cash flow coverage measures answer different questions. The cash bridge exposes the calculation behind the finding instead of relying on a headline KPI alone.
Validation establishes local technical checks on a small, manually prepared public-data extract. It does not establish external UAT, production deployment, scheduled refresh, client adoption, or a corporate decision changed by the analysis.
This example communicates selected public metrics and analytical methods. No confidential client records, identities, system details, or acceptance documents are included. Dominion Systems Inc. outcomes remain separately attributed to internal program reporting.
Featured portfolio
Three examples of how I turn data into decision support. Open each project to explore its methods, charts, and source evidence.
Financial figures: Company financial data and independent model estimates—not revenue, savings, or investment returns generated by my work.
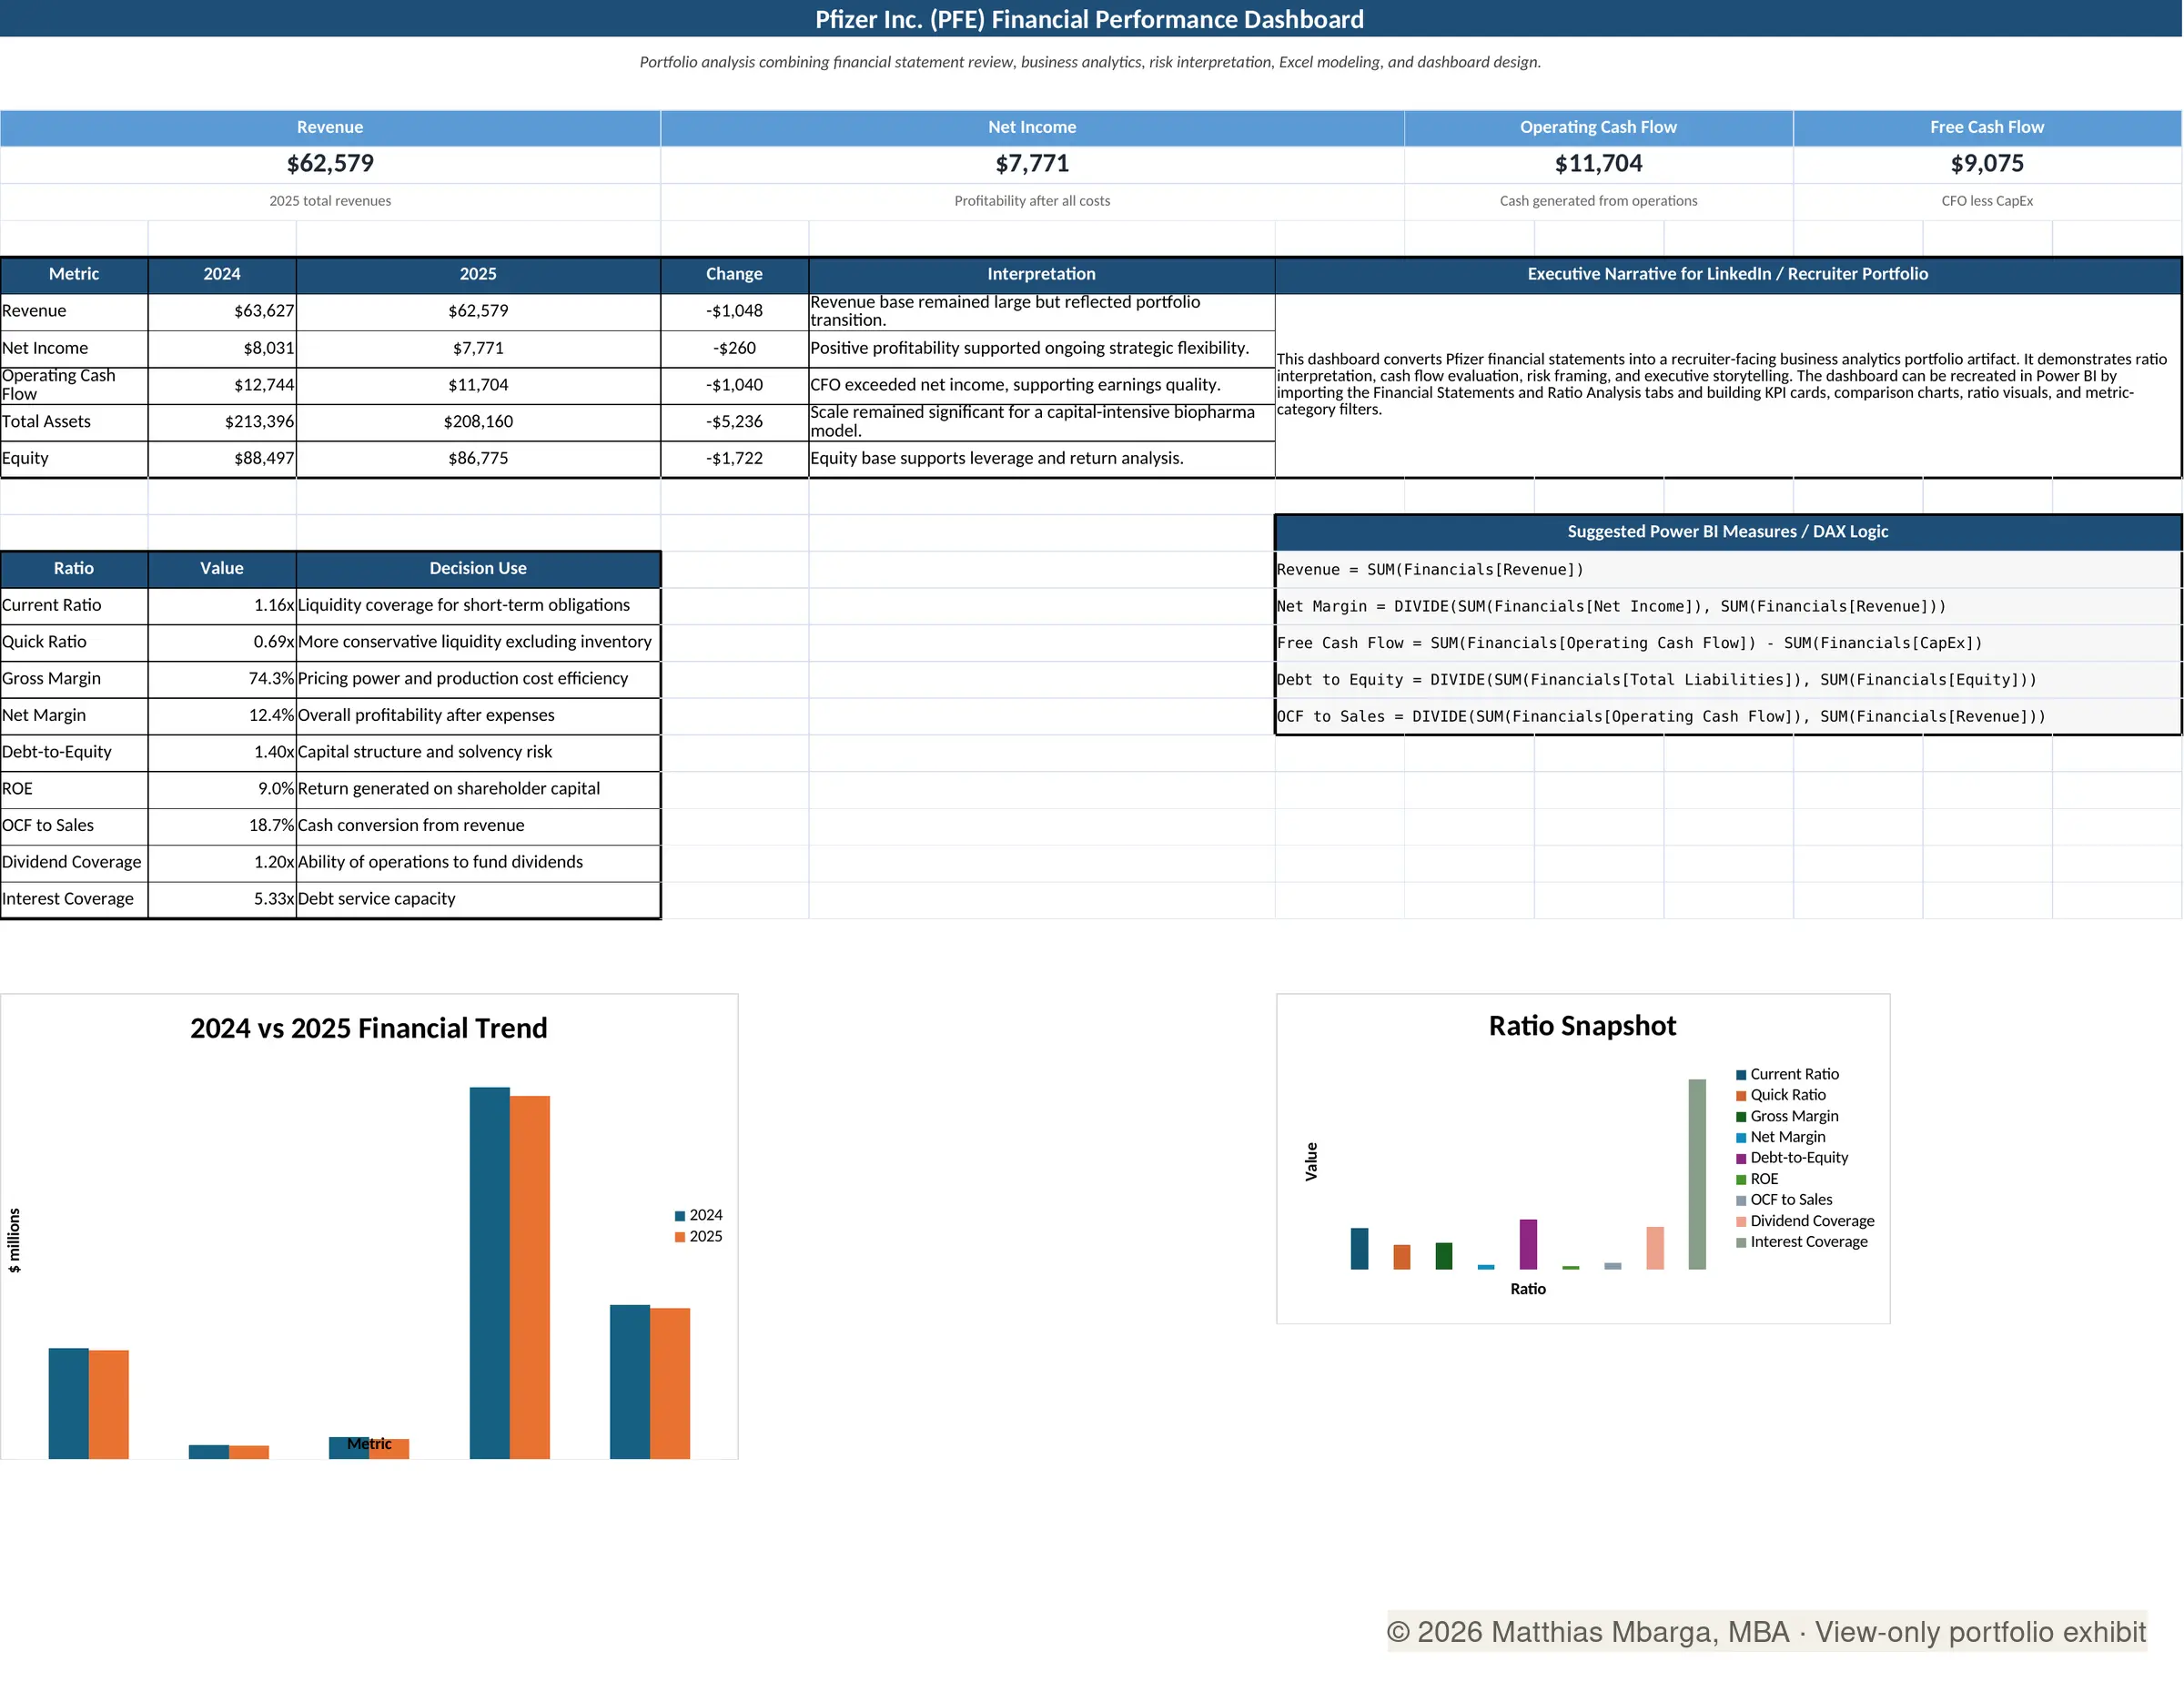
FY2025 free cash flow fell about $696M short of cash dividends.
My role: Independent analyst
Evidence: Public filing and inspectable calculations
The FCFF model estimates value below the $234.87 reference price.
My role: Independent financial modeler
Evidence: 17 analytical views · 1,241 formulas
Independent estimate; not investment advice.
Compare forecast responsiveness and historical error before selecting a method.
My role: Forecast modeling and comparative analysis
Evidence: Workbook with MAD, MSE, and MAPE
Historical comparison; a separate holdout is not documented.
Browse the full project archive ↗ Engineering background ↗
A silent, photo-based introduction to Matthias’s business analysis, business intelligence, and systems integration work.

Professional profile
Matthias Ngol Samba Mbarga, MBA, is a Senior Business Analyst with 15+ years across financial reporting, enterprise systems, and data platforms.
At Dominion Systems Inc., he connects requirements, KPI definitions, source data, and reporting workflows, coordinating business, data, and engineering teams through review and user acceptance.
Systems integration is a core strength: mapping data flows, aligning interfaces and reporting requirements, and translating between stakeholders and technical teams. His engineering background supports practical delivery; his MBA in Finance supports valuation, forecasting, and executive interpretation.
Resume & Professional CV
Requirements leadership, reporting delivery, SQL validation, and systems integration experience. Review the delivery case and technical evidence alongside the résumé.
A broader record of professional experience, education, analytical work, and research.
Selected open research: AI + ARIMA forecasting · Agentic AI and portfolio risk workflows · All projects & publications
Independent consulting: KPI assessments, dashboard requirements, systems integration, and analytics governance. Discuss a defined scope
Education & selected credentials
A concise set of credentials supporting business analysis, business intelligence, financial reasoning, and data-driven decision support.
Review professional profile ↗Graduate education
Graduate study · In progress
Professional certificate
Expert certification
Available for conversations
Available for business analysis, reporting, systems integration, and BI opportunities in the DMV or remotely.
Evidence and attribution
Professional experienceReported outcomes include employer, role, period, and scope where disclosure permits.
Independent analysisModels built from public data demonstrate analytical methods. They do not imply endorsement by the companies studied.
Results and assumptionsProjections and operational targets are labeled separately from reported outcomes. Reported outcomes have not been independently audited.
| Work | Reported result | Context |
|---|---|---|
| Platform reliability | 99.95%+ availability | Dominion Systems Inc. internal program reporting, 2019–2021 |
| Database performance | 30–45% lower query latency | Reported Verizon engagement result, 2015–2016 |